
While most operators fret about increasing foot traffic and check size, there may be a surprising factor killing profits. And that’s restaurant waste.
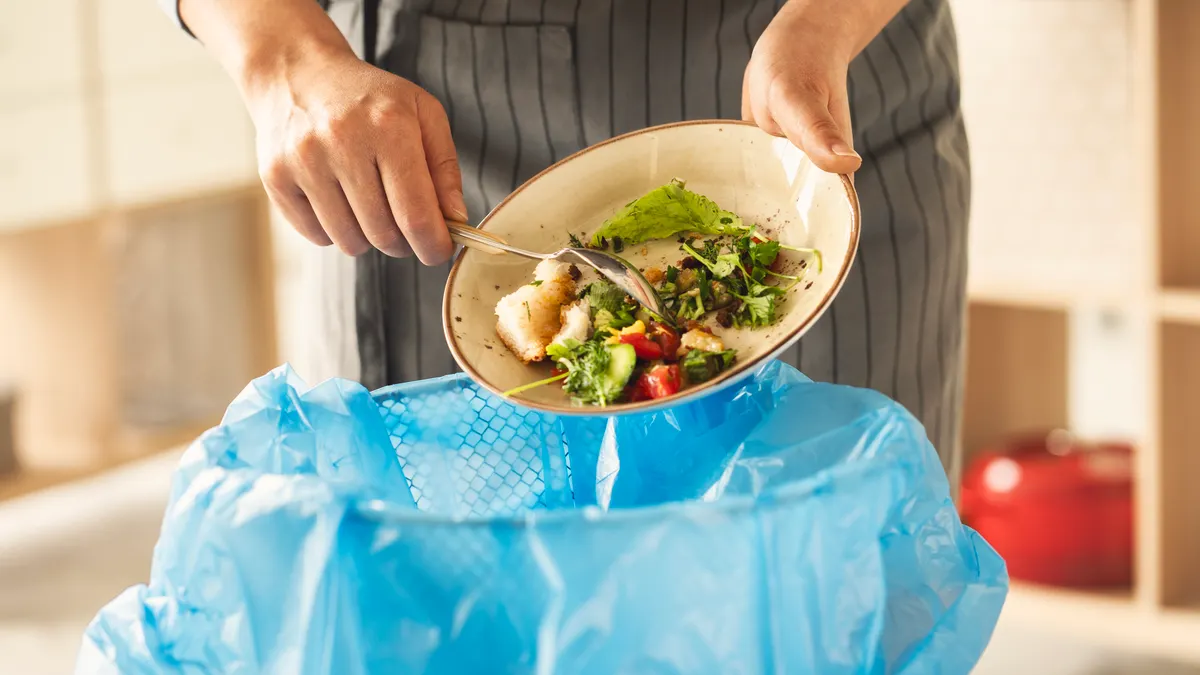
Leading food waste nonprofit ReFED estimates that full-service and limited-service restaurants waste an average of 5.4 million and 2.8 million tons of food, respectively. That’s bad for society and the planet, and an opportunity for restaurants to make a difference, right in their own community.
With 82% of restaurant operators reporting higher food costs, according to the National Restaurant Association’s 2026 State of the Restaurant Industry report, even small inefficiencies can quickly erase profitability.
However, restaurant “waste” doesn’t always look like food in the trash, with factors like over-ordering, inventory discrepancies, over-prepping, manual processes and missed menu optimization opportunities all contributing. The challenge is that many of these costs are difficult to see in day-to-day operations, making them easy to overlook even as they add up to thousands of dollars in lost revenue and unnecessary purchases. That’s because while restaurant operations generate a lot of data—invoices, counts, sales, recipes—most lives in disconnected systems.
“An operator might see a weekly food cost number but not see why it moved,” explains David Cantu, CEO of Craftable, a software platform that replaces disconnected spreadsheets and manual processes with automated, real-time visibility into food costs, vendor spend and operational margins. The mismatch could stem from an endless list of factors: over-ordering on proteins, spoilage from a slow weekend, a vendor stealthily raising prices on a mid-tier SKU or even employee-related shrink... Without the connective tissue between purchasing, receiving and actual usage, those losses look like the cost of doing business rather than fixable problems.
Measuring the Cost of these Hidden Inefficiencies
The real risk is normalization, says Cantu. “We see operators who've been running at a two to three point food cost variance for years and have genuinely stopped questioning it. But you can't fix what you don't know exists, and you definitely can't scale a business built on unexamined margin loss.”
In his experience, the biggest culprits are over-ordering (buying out of habit rather than to forecasted need), receiving errors that never get reconciled (you're invoiced for 10 cases but only eight arrive), price creep from vendors (a SKU goes up $0.40 and just rolls through), and manual processes that limit visibility.
According to Cantu, addressing these issues starts by connecting purchasing, receiving, invoices and inventory so variances surface before they become margin loss. Craftable does this through intelligent ordering that connects to live vendor pricing and historical usage, so orders are grounded in actual data. In addition, its three-way invoice matching—PO, delivery receipt and invoice—auto-flags concerns proactively, and its inventory module connects physical counts to recipe costs using live pricing, so an operator can see actual versus theoretical cost and know exactly where the variance is coming from, down to the line item.
While generic AI can spot patterns in data, it doesn't understand that a seasonal cocktail menu change affects inventory turns across six categories, or that a substitution from your produce vendor changes your plate cost even if the invoice looks similar. Restaurant operations require context, not just pattern recognition. The benefit of restaurant-specific AI trained on hospitality operational data is that it understands how these moves affect purchasing, recipes and margins.
Craftable’s AI layer, dubbed “Crafty,” goes further by connecting inventory data directly to recipes. For example, it can recommend specials that use ingredients already on hand or flag how a seemingly innocuous vendor substitution elevates the cost per plate. “To allow for that kind of proactive identification, the AI must understand what the data means in a restaurant context, not just what the numbers say,” Cantu says.
Hiding in Plain Sight?
One challenge is that many operators know they're losing money somewhere but struggle to quantify where it's happening. To help better understand the impact of hidden operational inefficiencies, Craftable recently launched its “Cost of Inefficiency Calculator” that illuminates gaps so they can be addressed head-on.
As Cantu shares, it arose from a constant refrain that operators couldn't put a number to their losses, which complicated the ability to effect change internally. Rather than relying on broad industry averages or hypothetical savings, the tool estimates the financial impact of specific operational challenges to inform strategy.
The calculator includes factors that came directly from patterns it observed across the customer base and the line items with the clearest, most measurable impact: invoice processing time, food cost variance, over-ordering and inventory discrepancies.
As a result, one of the most consistent stories Craftable hears from new customers is how they’ve uncovered meaningful opportunities after taking a closer look at these hidden costs.
For example, bartaco, which specializes in upscale street tacos and specialty beverages at 32 locations, cut food cost variance by 50% and saves more than $30,000 per week in food costs since implementing Craftable, while freeing operators to focus on execution and guest experience.
Sugarfire Smokehouse, which serves award-winning BBQ at 11 locations, saw a 4.5% food cost reduction, and TC Restaurant Group, which curates artist-driven venues in Nashville, Gatlinburg and Pittsburgh, cut variance by 80% and saves 30 labor hours per month just on reporting.
“What's interesting is that in most cases, these operators weren't doing anything dramatically wrong before; they just didn't have adequate visibility,” says Cantu. “With a better view of costs at the recipe level, adjustments that used to feel like guesswork became straightforward decisions.”
Operators consistently underestimate the compounding effect, which comes from focusing on a daily number, rather than an annualized one. For example, while a 2% food cost variance sounds manageable, at $5M in annual revenue, that's $100,000 walking out the door every year.
Another effect is the labor cost of manual processes, where the hours a team spends entering invoices, reconciling spreadsheets and chasing discrepancies could be better spent on the floor and the overall guest experience.
Cantu sees invisible waste as more than a food cost problem. “It's an operations problem, a culture problem and ultimately a growth problem because you can't scale what you can't see.”
As operators look for every available margin point in today's challenging environment, the opportunity isn't just to reduce waste, but to make invisible waste visible. To assess your own operations and uncover potential opportunities for savings and growth, try the Cost of Inefficiency Calculator here.